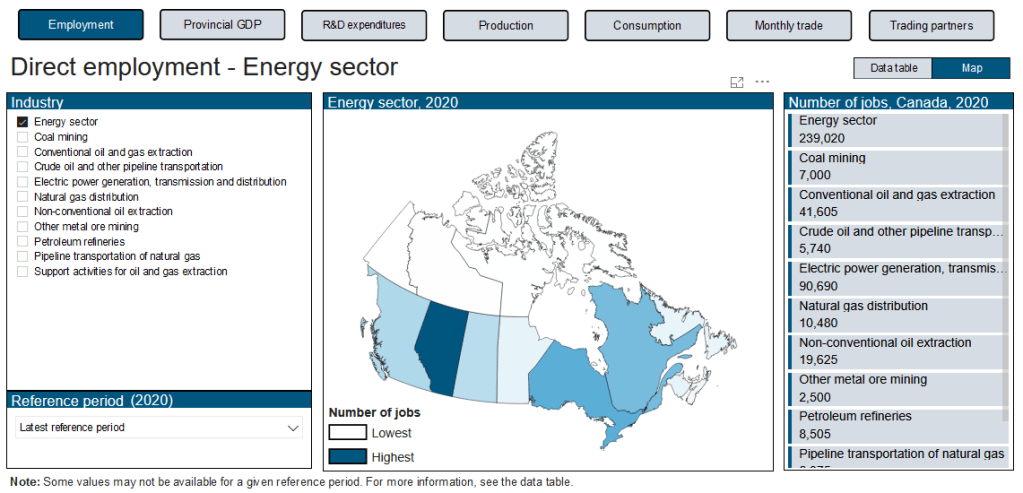
Modernization of DVPs
Net farm income, by province
I worked on improving the functionality of dashboard by creating new relations between UI elements, such as the map and the charts.
Additionally, I brought historical data (50+ years instead of 10) to allow for comparison between previous reference periods.
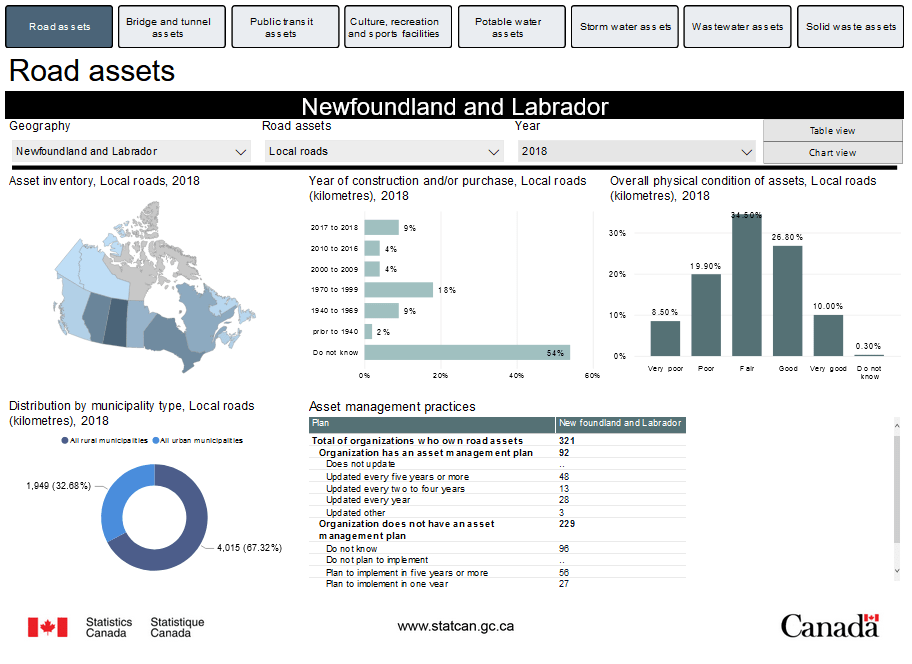
Development of data hubs
Canada’s Core Public Infrastructure Survey: Interactive Dashboard
I continued the development of the largest data hub. It combines 30+ data tables to provide an overview of infrastructure assets.
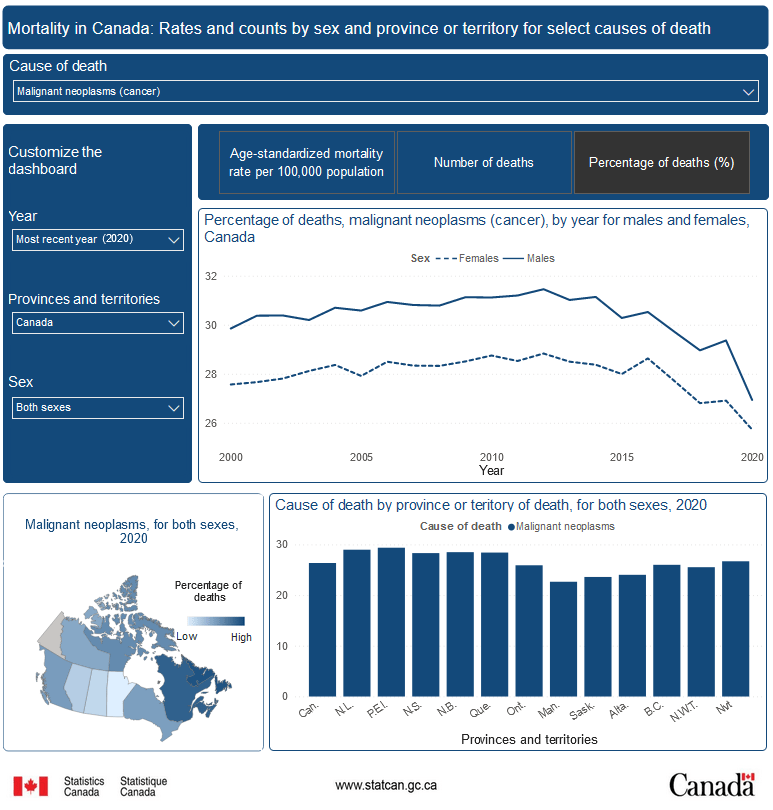
Client consultations
Canada’s Beef Visualizing mortality in Canada
I consulted clients to help them make their products comply with StatCan’s accessibility guidelines.
I helped clients to work with the data queries to make change from the source output to make DVPs more user friendly.
Client consultations
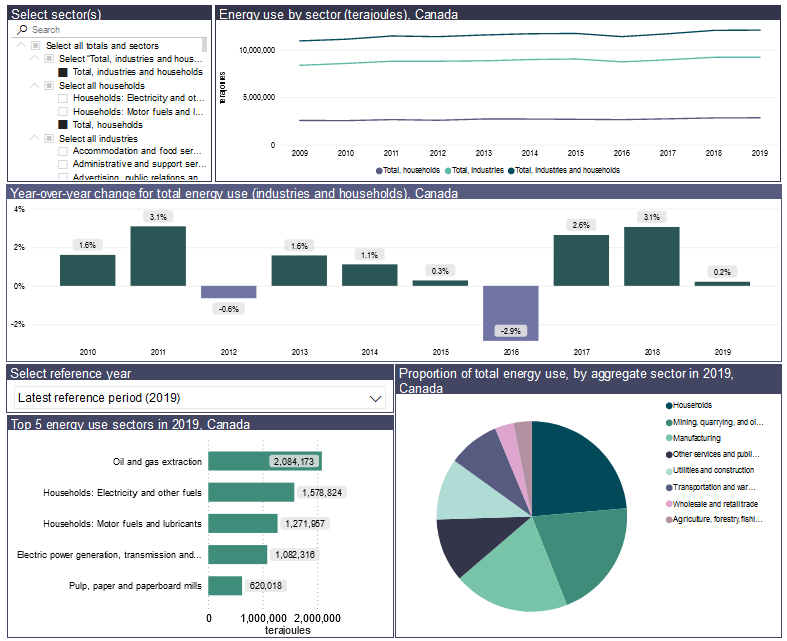
Physical flow account for energy use
I created custom dashboards based on the clients requirements, this included creating automated tools that refresh when new data is available.
This also involved creating responsive UI elements such as titles, and buttons.
Client consultations
Physical flow account for energy use
I worked with the Canadian Centre for Energy Information to develop custom dashboards that show the energy use of Canadians.
This involved working with multiple stakeholders to validate the design and settle on a dashboard that would work for everyone involved.