Visual analytics in precision medicine: Using mixed methods to support stakeholder data needs
Since the introduction of precision medicine, health consumers are increasingly needing to interact with digital interfaces to report their health data. This creates new challenges for the design of interactive systems: 1) the symptoms of an illness can often be located to an activity or a body part and untrained patients struggle to communicate them clearly, and 2) Health consumers and data analysts rarely communicate with each other about their data needs and concerns. To address these issues, I conducted a study in ethnomethods in a precision medicine company to understand the data requirements of health analysts (N=5). This exploration led to one methodological recommendation for short-term ethnography for VA, and four design guidelines that translated into a data capture system that visually maps a clinical data ontology to a graphical depiction of the body. My system is rooted on the human phenotype ontology to support health care workers to provide more accurate analyses and find new correlations, aid caregivers in managing health risks and empower patients to take action to better their health. The somatic representation was tested on lay users (N=8), and the results show that the representation allowed patients to have a more accurate and descriptive understanding of their illness experiences, and by doing so it captured more reliable data. While my system captured fewer conditions (mean=5, SD=1.852) vs a simple, text-based form (mean=5.65, SD=1.922), it was shown to be more accurate since it captured fewer false positives (mean=1.625, SD=1.768) vs. (mean=5, SD=5.701).
Approaching the end of the second decade of the 21st century, mobile management of one’s own health is becoming increasingly prevalent in western societies. This has been fostered by the declining costs of biomolecular testing [1] and Big Data advances in analysis methods for the omics and serves as foundations for a paradigm shift towards personalized and preventive medicine, increasing the need for health care consumers to directly access and interact with the digital version of their own records
The field of Visual Analytics (VA), defined as “the science of analytical reasoning facilitated by interactive visual interfaces” [2] grew out of Information Visualization (InfoVis) and Scientific Visualization (SciVis) to become a highly interdisciplinary discipline that is mainly informed by computer science and cognitive science, placing a focus on the human as the center of research.
Methods from VA can support integrative analysis that consider both, the health data analysts and health consumers’ needs in an information communication loop. By doing so, it’s possible to focus on data infrastructures that contain controlled vocabularies to facilitate the communication between both parties. VA con provide frameworks to account for the health consumer’s experience in the design of analytical-support systems for analysts.
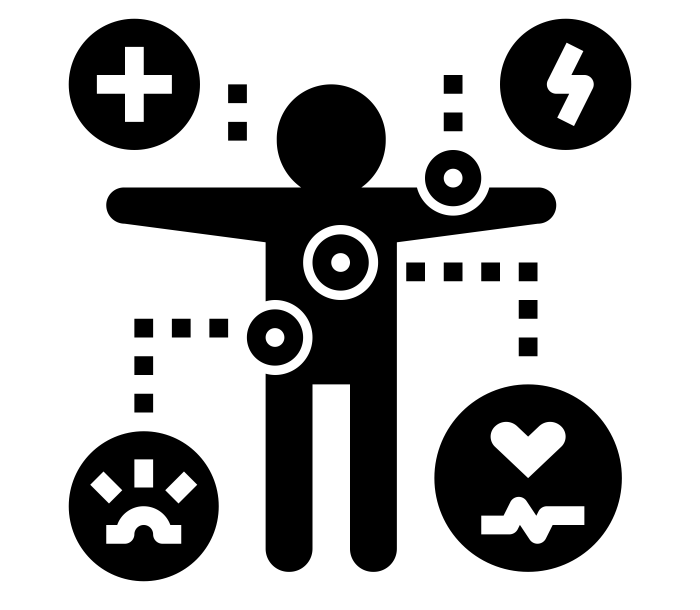
Problem
Symptoms can be related to body part/system/activity
Access to digital health is mediated by digital interfaces
Data Analysts and Health Consumers rarely talk
Design Thinking
Design Thinking (DT) is a term that has shown a growth in its use, with applications being found in disciplines ranging from business to IT to healthcare. One of the main reasons for the rise in popularity is the seemingly universal applicability to any type of problem.
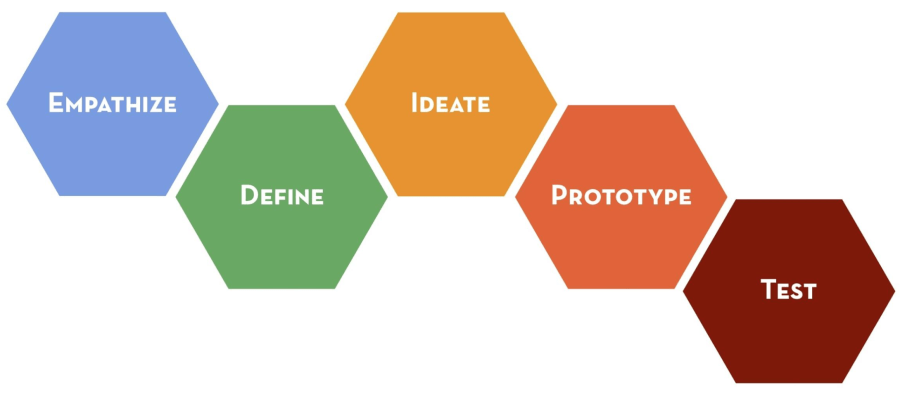
Stanford’s 5-Step Design Thinking Framework
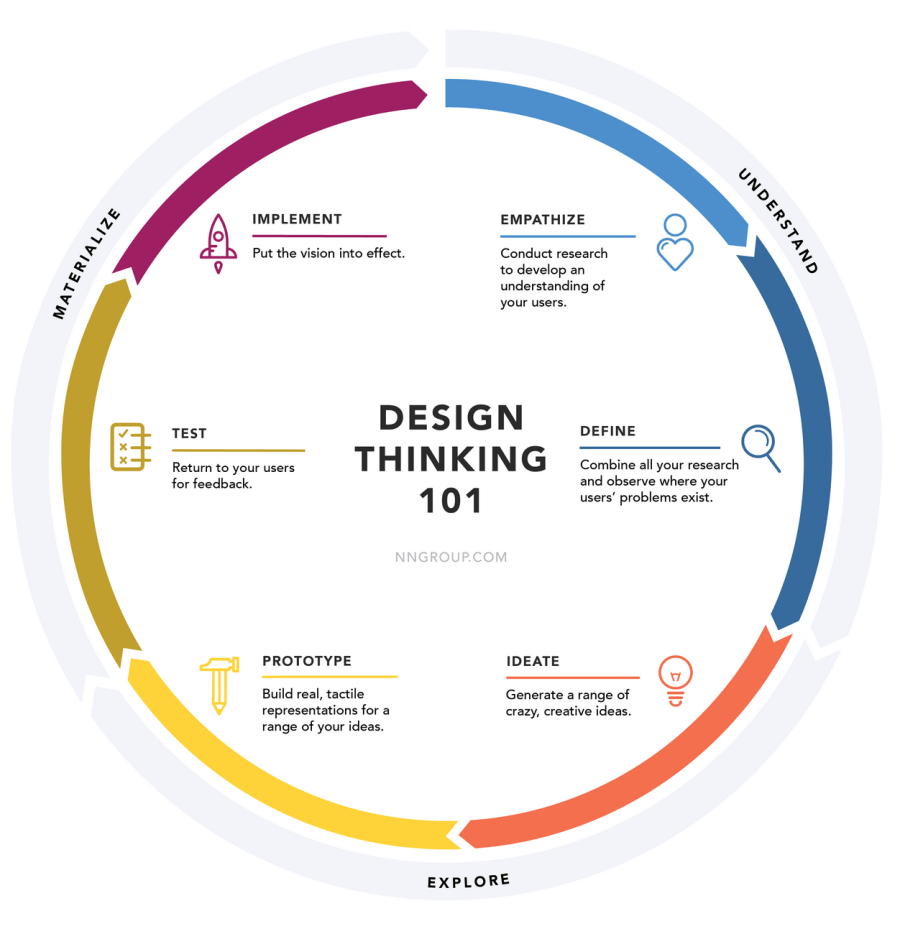
In popular culture, Stanfords 5-step DT [3] approach has seen a spread of the methodology and its implementations across different fields, yet this has also caused an oversimplification of the methodology and a lack of focus on the research component. In that sense, Nielsen Norman’s framework [4] is rooted in research which can scaffold methodologies and methods that can be applied to the design and evaluation of VA systems.
Norman Nielsen Design Thinking Framework
Research Questions
How to design an interactive system for capturing descriptive patient data to support automatization in precision medicine?
Overarching Mixed Methods Research Question
How can a distributed cognition lens for short-term ethnography inform the design of visual analytics systems in the context of correlating patient descriptive data with biomolecular data?
Qualitative Research Question
Can an interactive system for capturing descriptive patient data help patients to accurately report their conditions?
Quantitative Research Question
Methodology & Methods
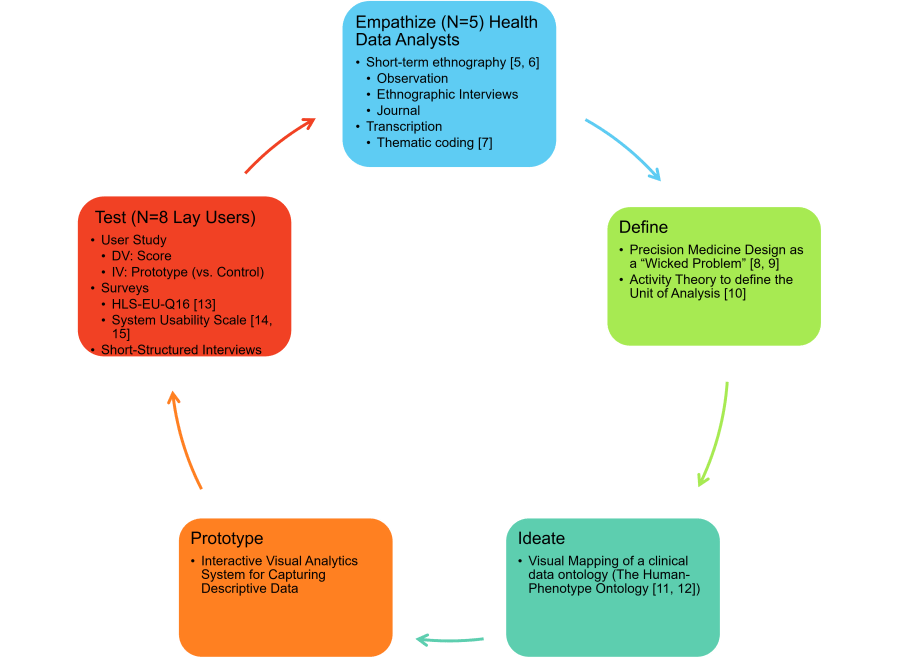
Adapted Design Thinking Framework to incorporate Mixed Methods for Visual Analytics
Prototype Design
Overview of the system
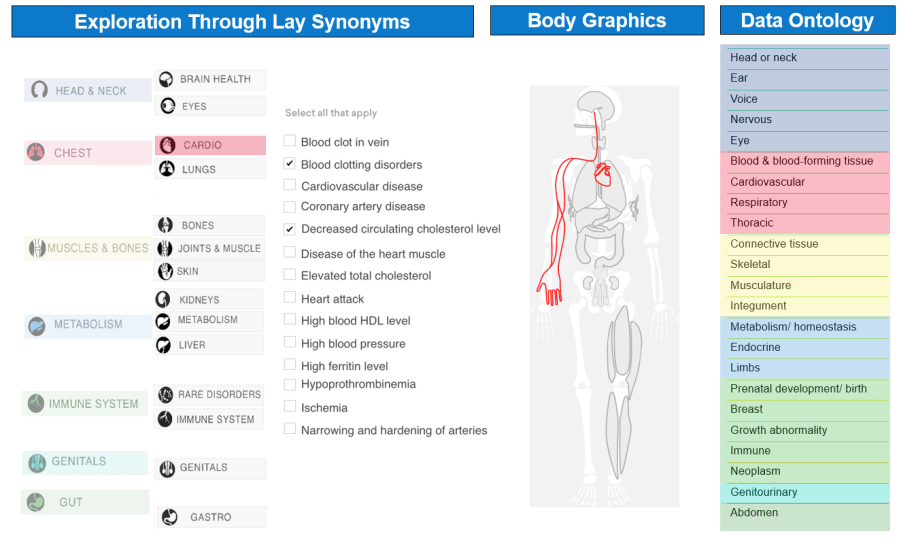
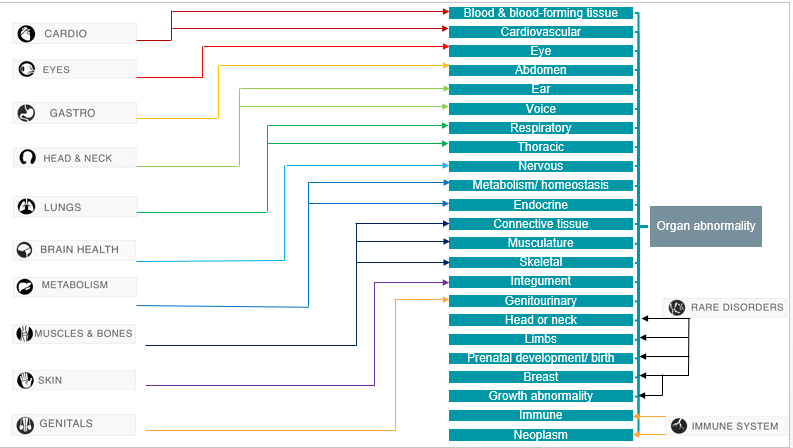
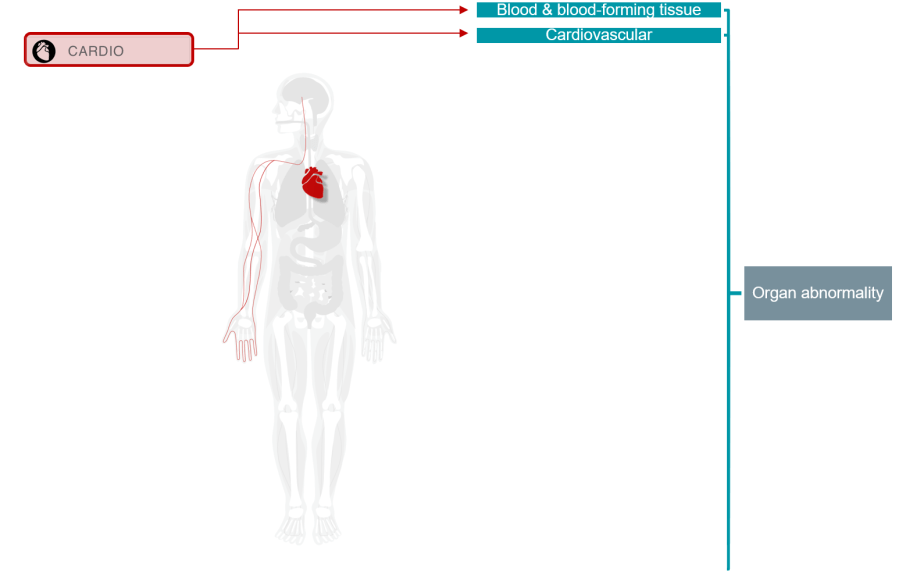
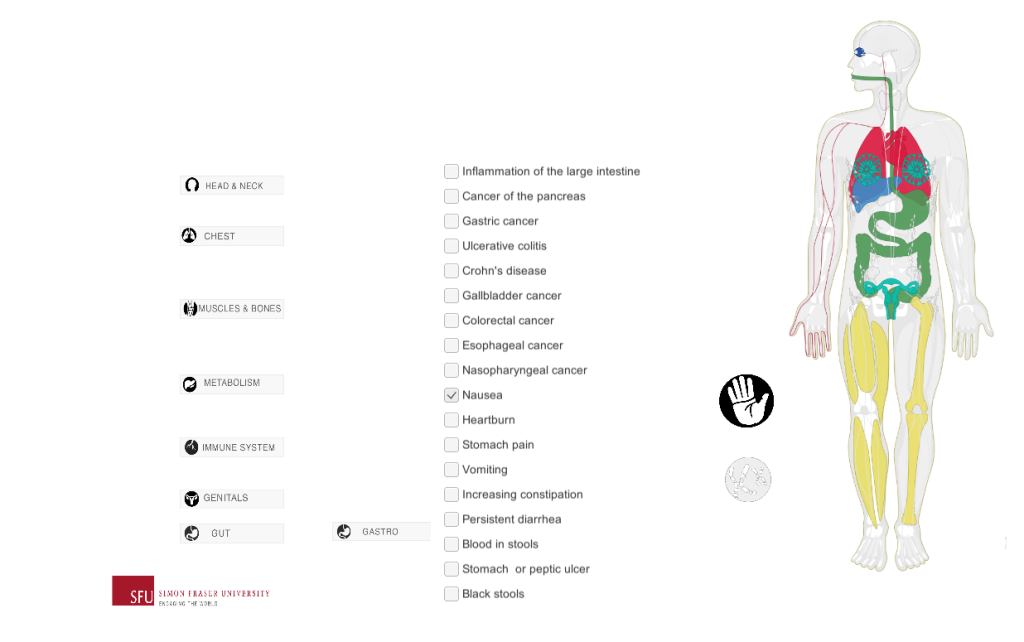
I) Mapping the Human Phenotype Ontology to the categories for the Prototype buttons. Categories were refined with input from lay users.
II) Mapping the HPO to the buttons and the body graphic. Example of Visual feedback for the “Cardio” category
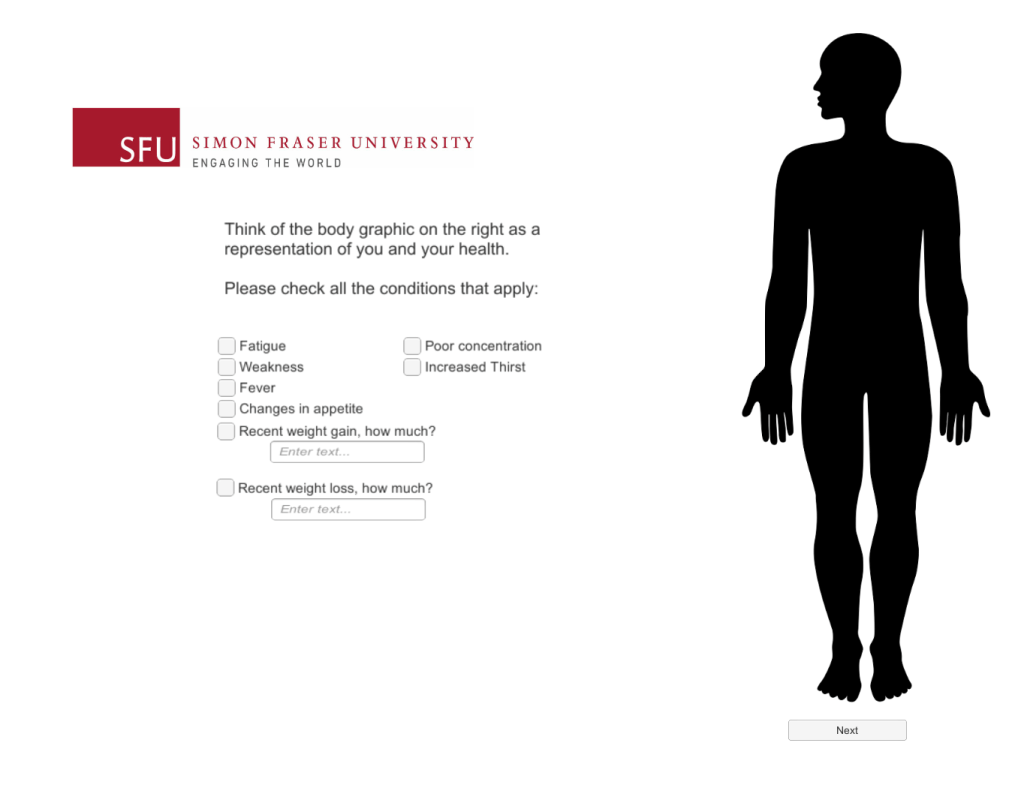
III) Prototype: Introduction Scene where the user reports symptoms + gets introduced to the somatic representation
IV) Prototype: Interactive Scene where the users selects conditions. The visual feedback adds up when the user selects conditions from multiple body systems/categories.
Results
Evaluation
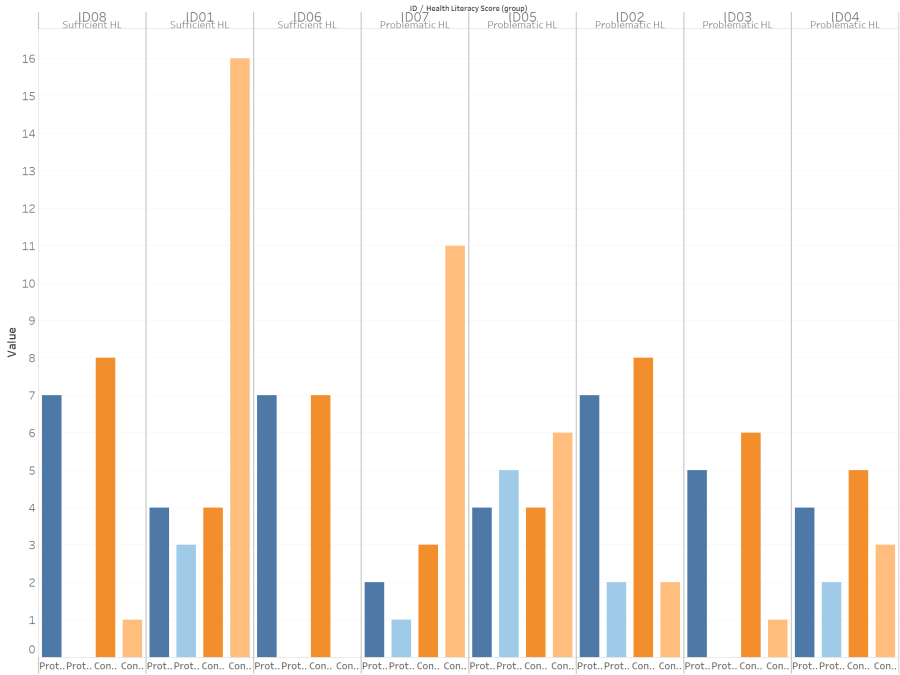
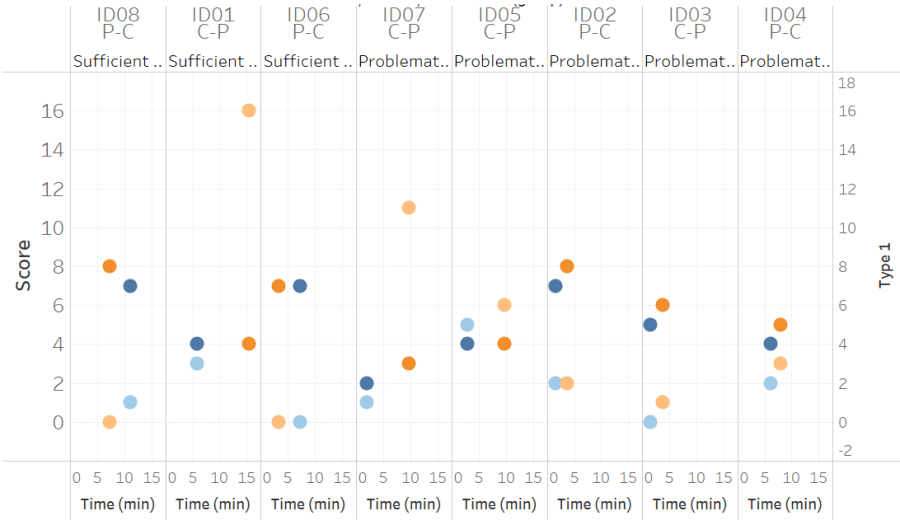
Results from User Study (Ordered in descending order of Health Literacy)
Score & False Positives vs time spent using the interfaces
Summary Statistics
Prototype
Control
Score Median
4.5
5.5
Score Mean
5
5.625
Score Std Dev
1.852
1.923
False Positives Median
1.5
2.5
False Positives Mean
1.625
5
False Positives Std Dev
1.768
5.707
Study Descriptive Statistics (Score was out of 10)
Health Literacy Score
Health Literacy
Median
11.5
Problematic
Mean
11.75
Std Dev
2.712
Participant’s Health Literacy Summary[13]
System Usability Scale
Score Median
70
Score Mean
68.75
Score Std Dev
6.547
Usability Score (>= 70 is a good interface)[15]
Proposed Guidelines
Methodological & Design Guidelines
Methodological Guideline 1: Understanding and Designing for Stakeholders
• Identify and design from the perspective of the most vulnerable stakeholder and prioritize those needs when incorporating other stakeholder’s requirements.
Methodological Guideline 2: Data Provenance
• Trace the production of data to understand the shortcomings of its creation and always maintain a critical attitude to what the data should represent
Design Guideline 1: Supporting Health Literacy
• Support automation by using a controlled vocabulary, such as a clinical data ontology, to streamline the data capture process.
Design Guideline 2: Prioritizing Interactivity and Visual Feedback
• Accommodate the health consumer’s health literacy through visual mapping of the controlled vocabulary to facilitate interaction and visual feedback.
[2] Thomas, J. J., & Cook, K. A. (2005). Illuminating the path: The research and development agenda for visual analytics. IEEE Computer Society, 184. https://doi.org/10.3389/fmicb.2011.00006
[5] Pink, S., & Morgan, J. (2013). Short-term ethnography: Intense routes to knowing. Symbolic Interaction, 36(3), 351–361. https://doi.org/10.1002/symb.66
[6] Millen, D. R. (2000). Rapid ethnography: Time deepening strategies for HCI field research. Proceedings of the Conference on Designing Interactive Systems: Processes, Practices, Methods, and Techniques, DIS, 280–286.
[7] Geysler, C., & Swarts, J. (2019). Coding Streams of Language. Techniques for the Systematic Coding of Text, Talk, and Other Verbal Data. Boulder: University Press of Colorado. https://doi.org/10.1017/CBO9781107415324.004
[12] Köhler, S., Vasilevsky, N. A., Engelstad, M., Foster, E., McMurry, J., Aymé, S., … Robinson, P. N. (2017). The human phenotype ontology in 2017. Nucleic Acids Research, 45(D1), D865–D876. https://doi.org/10.1093/nar/gkw1039
[13] Sorensen, K., Van den Broucke, S., Pelikan, J., Fullam, J., Doyle, G., Slonska, Z., … Brand, H. (2013). Measuring health literacy in populations: illuminating the design and development process of HLS-EU-Q. BMC Public Health, 13(1), 948. https://doi.org/doi:10.1186/1471-2458-13-948
[15] Bangor, A., Kortum, P. T., & Miller, J. T. (2008). An empirical evaluation of the system usability scale. International Journal of Human-Computer Interaction, 24(6), 574–594. https://doi.org/10.1080/10447310802205776